Page 1 of 2
Dashboard Widget: CPU Monitor
Posted: Tue Aug 19, 2025 1:18 pm
by noobychris
Hello together,
i wanted to share my cpu monitor dashboard widget

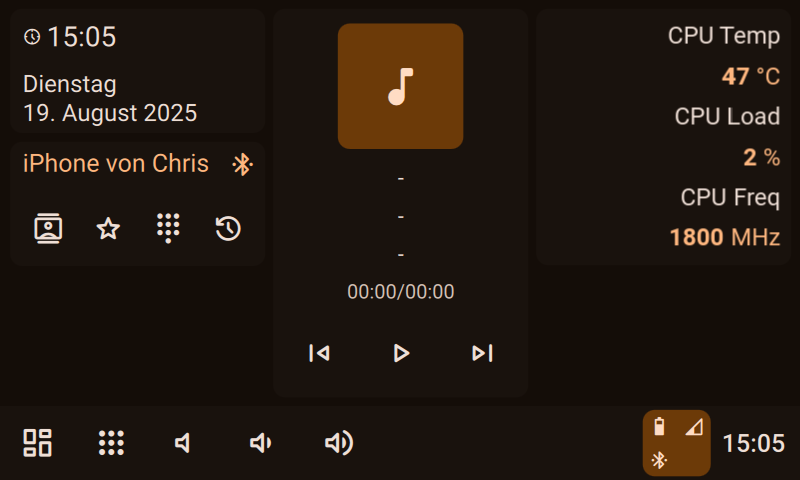
- 20250819_15h05m37s_grim.png (52.14 KiB) Viewed 1469 times
There is no need to install anything because the python script will do that for you.
You can change the temperature unit from °C to °F and the HTML will change the output automatically.
The cpu monitor widget adopts the theme when changes are made by hudiy.
Please do the first run with internet connection so the script can install missing python3 packages
I recommend to install all the hudi fonts system wide:
-Run these commands one after the other
Code: Select all
mkdir -p ~/.local/share/fonts
cp /home/pi/.hudiy/share/assets/fonts/*.ttf ~/.local/share/fonts/
fc-cache -fv
-Edit the file: "/home/pi/.hudiy/share/config/dashboards.json"
-Add the following line to the file:
Code: Select all
{ "type": "web", "size": "medium_narrow", "url": "file:///home/pi/scripts/cpu_widget.html" },
Caution: If you add this widget in the latest position, please remove the "," behind the "}":
Code: Select all
{ "type": "web", "size": "medium_narrow", "url": "file:///home/pi/scripts/cpu_widget.html" }
-Put the python file "can_widget.py" in the folder you like
-Set the correct permissions with shell
-or via fpt/ssh to 0755 (rwxr-xr-x)
-Run the script via command
-or put it in the autostart
How to autostart:
-Login into the shell
-Run the command
-Select the editor of your choice (i prefer nano)
-Add the following line at the bottom (make sure to adjust the path if needed):
Code: Select all
@reboot /usr/bin/python3 /home/pi/scripts/cpu_widget.py
-Save with CTRL+X
Re: Dashboard Widget: CPU Monitor
Posted: Tue Aug 19, 2025 3:03 pm
by spoologa
Thanks for sharing! This is awesome! This was a feature I had actually hoped had been included out of the box. The only additional thing I had to do apart from these instructions was setup a CRON job to get the python script to run on reboot. Without doing that the values were blank.
Re: Dashboard Widget: CPU Monitor
Posted: Tue Aug 19, 2025 3:33 pm
by noobychris
spoologa wrote: Tue Aug 19, 2025 3:03 pm
Thanks for sharing! This is awesome! This was a feature I had actually hoped had been included out of the box. The only additional thing I had to do apart from these instructions was setup a CRON job to get the python script to run on reboot. Without doing that the values were blank.
I've added the autostart instructions. Thanks!
Re: Dashboard Widget: CPU Monitor
Posted: Sun Sep 07, 2025 6:52 am
by wkl3968
I tried to execute to this instruction from a freshly build hudiy installer. first the cpu_widget.py and .html are hard coded with a known port. the different from other method suggested by HUDIY is dashboards.json setup. this example uses the file location stated in the dashboards.json. however, the example given by HUDIY uses http method. so my question, how to convert this example to http method? is the cpu_widget.py hard coded to look for the html file?
Re: Dashboard Widget: CPU Monitor
Posted: Sun Sep 07, 2025 11:18 am
by noobychris
Hi @wkl3968,
Short answer: You don’t need to “convert” the example. The HTML can be loaded either via
file:// or via
http(s)://. The Python script does
not look for the HTML file; it only runs a WebSocket server that the HTML page connects to.
Two ways to load the HTML
- file:///… – Easiest: no web server needed. HUDIY can show the page even if no server is running yet.
- Note: Browser APIs that require a secure context (e.g. getUserMedia) usually won’t work from file://.
- http(s)://… – Requires a web server, but it’s the right choice for things like the camera, because getUserMedia needs HTTPS or http://localhost.
How to use the HTTP method
Start a small server in the folder that contains your HTML and point HUDIY’s dashboard entry to it:
with python3 pre installed http.server:
Code: Select all
python3 -m http.server 12345 --directory /path/to/your/html
or with node-http-server like described from hudiy:
Code: Select all
http-server /home/pi/api/js -p 12345
Then use a URL like:
Code: Select all
http://localhost:12345/your_file.html
(With
file:// it would be e.g.
file:///home/pi/your_file.html.)
Is cpu_widget.py hard-coded to the HTML file?
No. The Python script:
- starts a WebSocket server (default: ws://127.0.0.1:8765),
periodically sends JSON messages (CPU temp/load/freq) to any connected page.
The HTML page itself opens the socket:
Code: Select all
const WS_URL = "ws://127.0.0.1:8765"; // change if your host/port differs
const ws = new WebSocket(WS_URL);
ws.onmessage = ev => handleMessage(JSON.parse(ev.data));
Re: Dashboard Widget: CPU Monitor
Posted: Mon Sep 08, 2025 1:39 pm
by wkl3968
Thanks for the detail education and guidance. I followed your instruction and inserted this
http://localhost:12345/your_file.html into dashboards.json. At first it still shows the exclamation mark (!) and I need to go other menu or refresh the startup dashboard, then the intended html is displayed. also, I get to learn that localhost is needed in the http path. I was using 0.0.0.0:12345 and it doesn't work. all good for now! thank you very much.
Re: Dashboard Widget: CPU Monitor
Posted: Mon Sep 08, 2025 3:19 pm
by noobychris
wkl3968 wrote: Mon Sep 08, 2025 1:39 pm
Thanks for the detail education and guidance. I followed your instruction and inserted this
http://localhost:12345/your_file.html into dashboards.json. At first it still shows the exclamation mark (!) and I need to go other menu or refresh the startup dashboard, then the intended html is displayed. also, I get to learn that localhost is needed in the http path. I was using 0.0.0.0:12345 and it doesn't work. all good for now! thank you very much.
You could simply do it with „file:///“ and wouldn’t need a Webserver to get
http://localhost:12345 running then.
Just saying … that are different methods and with „file:///„ hudiy can find and show the html file every time, so no „!“ Warning
Re: Dashboard Widget: CPU Monitor
Posted: Fri Sep 12, 2025 6:56 am
by wkl3968
During the initial startup, the obd dashboard html, which I use the webserver approach, keeps showing the exclamation image. The proper obd dashboard only refreshed appear correctly after I enter a different display page and back to Home. It appear to me that the webserver didn't startup correctly.
Re: Dashboard Widget: CPU Monitor
Posted: Fri Mar 06, 2026 3:40 am
by charpeasy
I tried to do this and now my dashboard is blank
Re: Dashboard Widget: CPU Monitor
Posted: Fri Mar 06, 2026 3:44 am
by hudiy
charpeasy wrote: Fri Mar 06, 2026 3:40 am
I tried to do this and now my dashboard is blank
This is likely due to invalid JSON syntax (e.g., a missing comma). You can use an online validator (
https://jsonlint.com/) to check your dashboards.json file syntax.